
STAC Presentation Diamond 0411
Applying Volunteer-based Butterfly Monitoring Data Toward Understanding the Responses of Butterflies to Global Climate Change
Sarah Diamond
North Carolina State University
APNEP-STAC meeting, 27 April 2011
Roadmap
- Overview of volunteer-based butterfly monitoring
- The UK Butterfly Monitoring Scheme (UKBMS)
- Applying monitoring data to develop predictive models for butterfly species’ responses to climate change

Volunteer-based butterfly monitoring
- Single-day counts
- 4 July counts [June-July] (and potentially more times per year [spring/fall], depending on the site)
- e.g., North American Butterfly Association (NABA)
- Recurring counts
- Often involve once-per-week counts for the duration of butterfly activity
- e.g., UK Butterfly Monitoring Scheme (UKBMS)
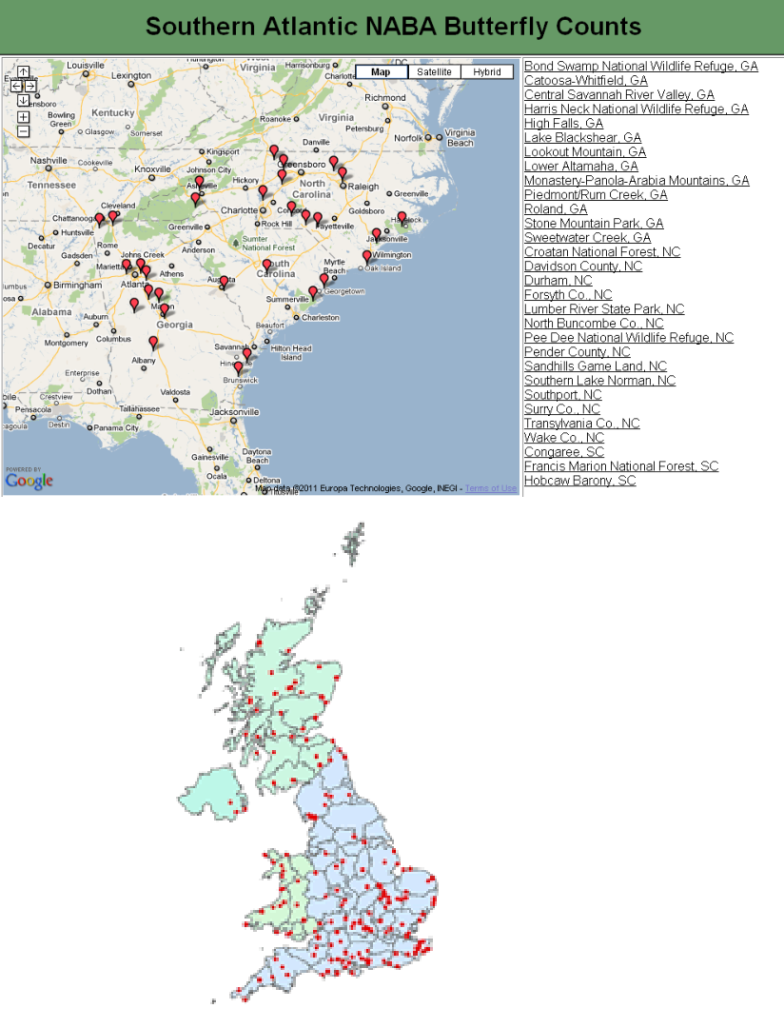
Volunteer-based butterfly monitoring
- Areas
- NABA: participants select a count area with a 15-mile diameter and conduct a one-day census of all butterflies sighted within that circle
- Transects
- UKBMS: participants walk transects (~1-4 km length x 5 m width) once-per-week starting 1 April through September, and census all butterflies along the transect (Pollard transects)
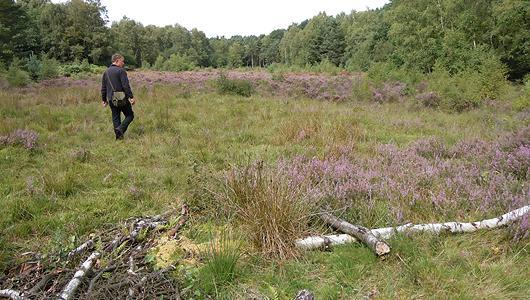
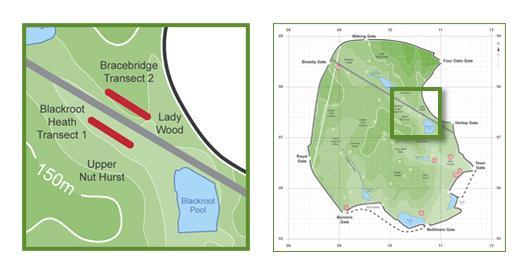
Mix of single-day, recurring, area, and transect butterfly monitoring in the US


Data collection and deposition
- Quality control on data
- NABA: minimum four adult observers, and 6 party-hours per count
- Data not conforming can still be submitted to Butterflies I’ve Seen (BIS)
- UKBMS: transect walks are undertaken between 10:45am and 3:45pm and only when weather conditions are suitable for butterfly activity: dry conditions, wind speed less than Beaufort scale 5, and temperature 13°C or greater if there is at least 60% sunshine, or more than 17°C if overcast
- Online field guide resources for identifications
- Submission of butterfly photographs with count data for confirming identifications
- NABA: minimum four adult observers, and 6 party-hours per count
- Most volunteer butterfly monitoring data are freely available from the web or upon request
Why monitor butterflies?
Butterfly phenology as an indicator of climate change
- Phenology: “recurring plant and animal life cycle stages, such as leafing and flowering, maturation of agricultural plants, emergence of insects, and migration of birds”
- With climate warming, phenologies of many organisms shifting
- Empirical evidence for earlier spring events & later fall events
- Asynchronies in timing of events as taxa have different phenological responses to warming
- Phenology identified by the Intergovernmental Panel on Climate Change (IPCC) as a key indicator of biological responses to climate change
Volunteer-based
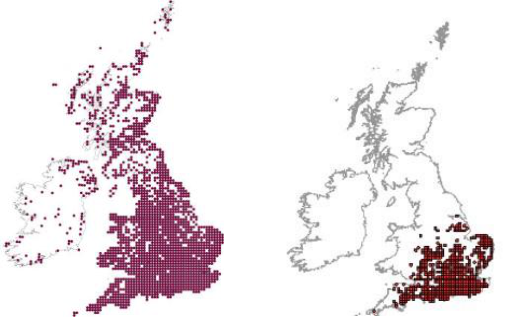
71 species
1500 sites
~ 26 sampling events / yr
Sampling 1976 to present
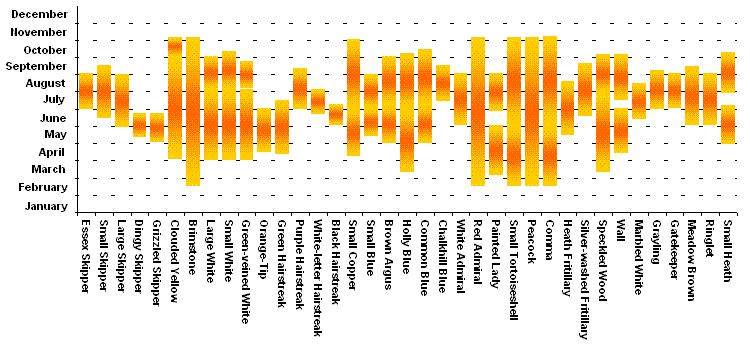
Flight phenology of UK butterflies
Increase in UK air temperature
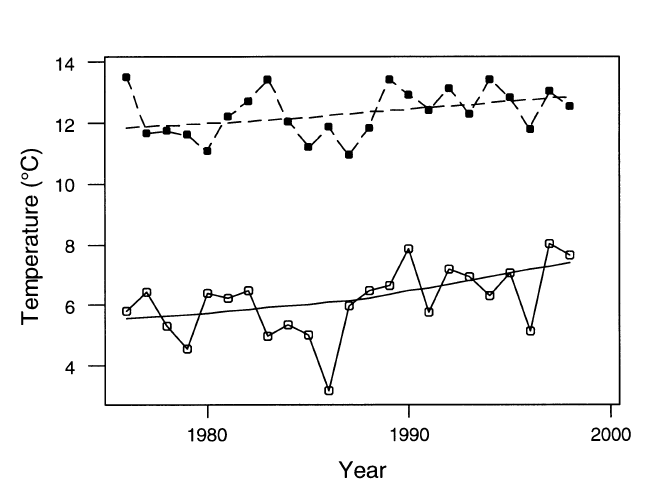
Summer (1 °C)
Spring (1.5 °C)
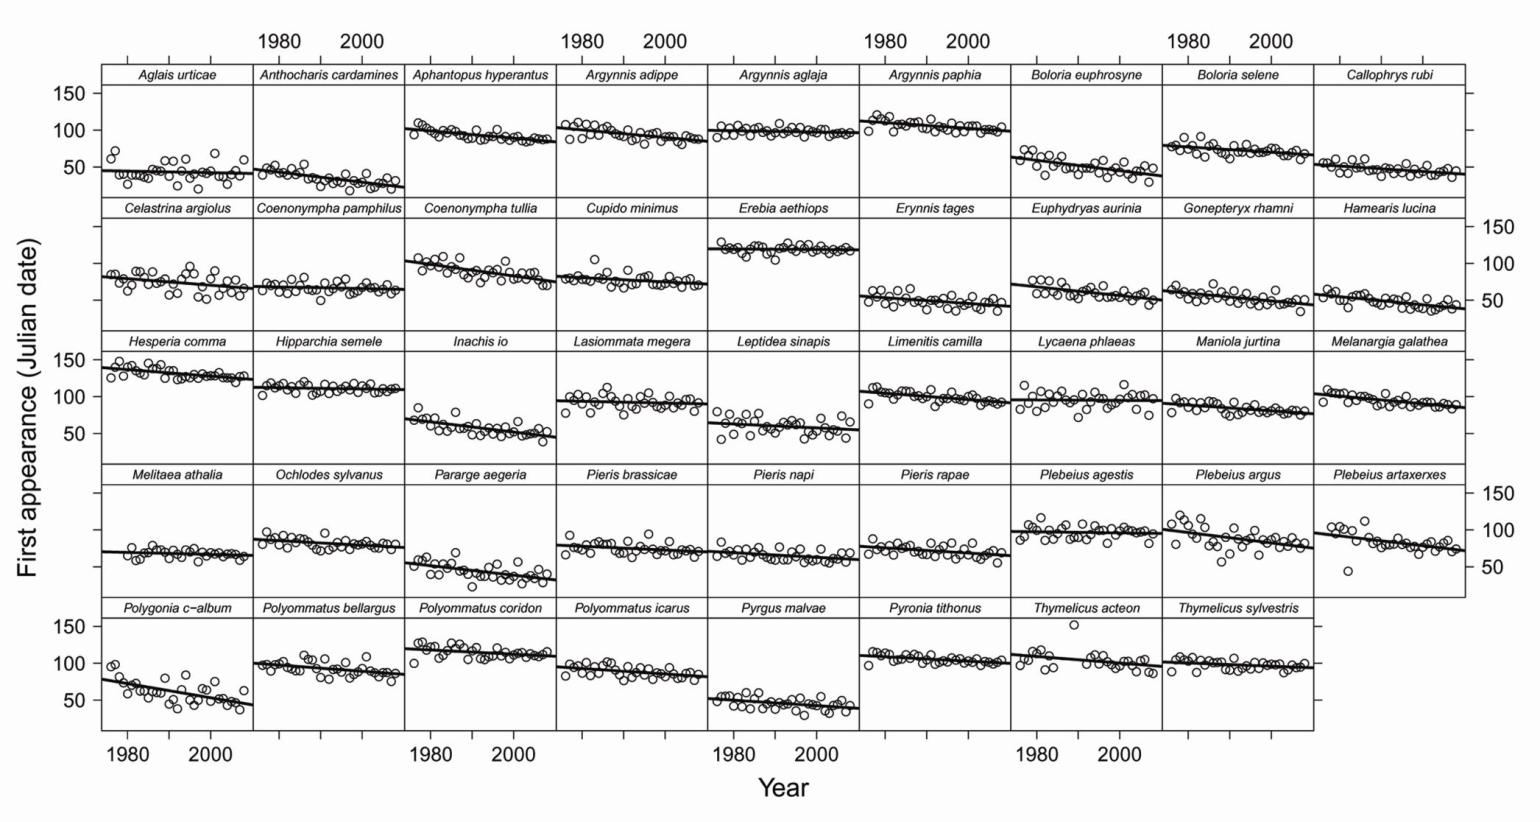
Flight phenology of UK butterflies:
Date of first appearance
Phenology of UKBMS species (1976-2008)
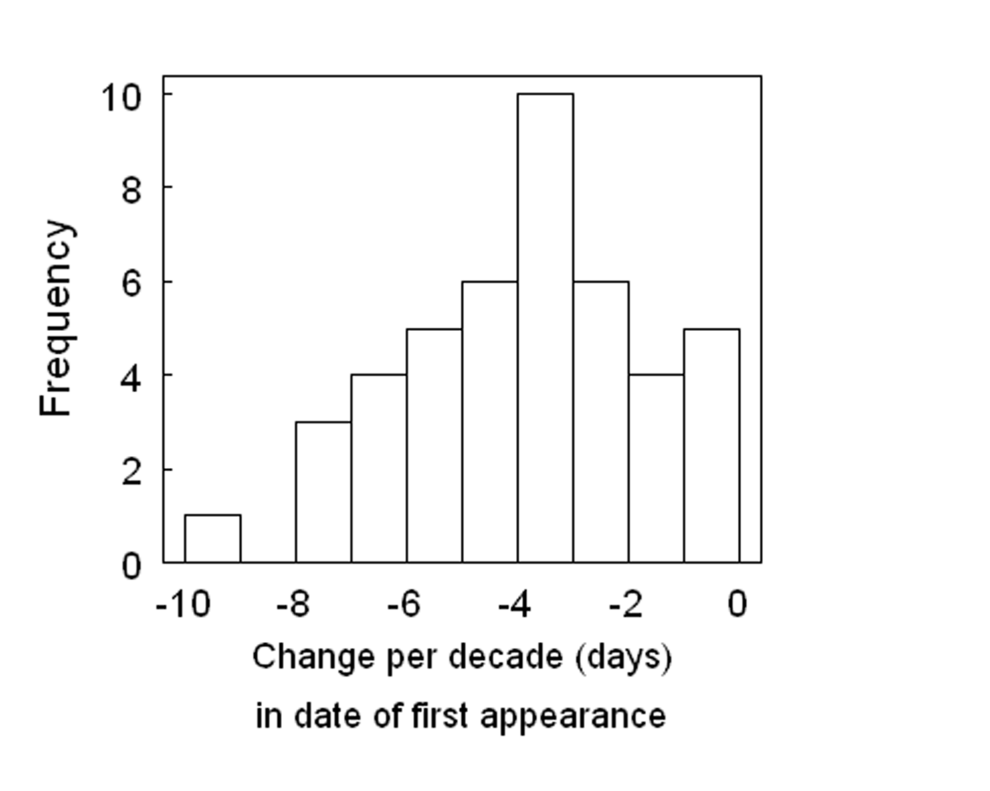
Phenological change per decade
All species tend to advance in their date of first appearance
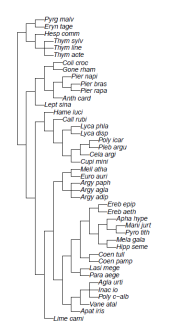
Can species’ traits and shared evolutionary history explain the degree of phenological advancement?
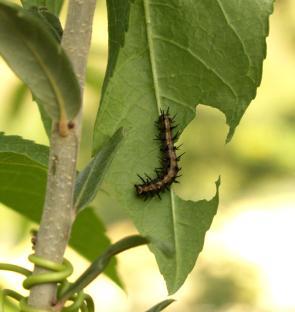
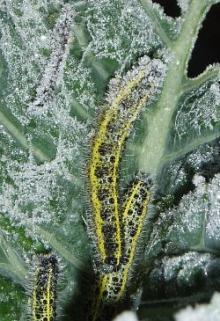
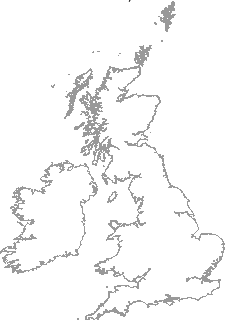
Diet breadth Overwintering stage Voltinism Dispersal Range & distribution Phylogeny
Analytical approach: phylogenetic glm
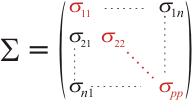
- linear model controlling for phylogenetic non-independence
- strength of the phylogenetic signal controlled by altering the parameter λ
- λ = 0 is equivalent to a standard linear model, with all shared phylogenetic history reduced to zero
- λ = 1 uses the original covariance matrix
- pglm scales the covariance between data points as the product of this shared history and λ (estimated using ML)
The goal: build a predictive model for butterfly phenological responses to climate warming based on species-level traits
Phylogenetic autocorrelation
Change in day of first appearance (per decade)
- Overwintering stage (egg, larva, pupa, adult)
- Number of larval host plant species
- Latitudinal extent (amount of UK mainland occupied)
- Percent national 10km grid cells occupied
- Voltinism
- Dispersal ability
- Julian day first appearance (1975)
Phylogenetic autocorrelation
λ ~ 0 (full model pglm); Moran’s I = -0.02, p = 0.41
Virtually no phylogenetic signal in phenological advancement
Change in day of first appearance (per decade)
- Overwintering stage (egg, larva, pupa, adult)
- Number of larval host plant species
- Latitudinal extent (amount of UK mainland occupied)
- Percent national 10km grid cells occupied
- Voltinism
- Dispersal ability
- Julian day first appearance (1975)
Model selection approach:
what combination of parameters best predicts the degree of phenological advancement?
(all main and two-way interactions)
Change in day of first appearance (per decade)
- Overwintering stage (egg, larva, pupa, adult)
- Number of larval host plant species
- Latitudinal extent (amount of UK mainland occupied)
- Percent national 10km grid cells occupied
- Voltinism
- Dispersal ability
- Julian day first appearance (1975)
Best-fitting models (ΔAICc < 2)
Dispersal and voltinism absent from best-fitting models
Models with strongest empirical support contain: annual day of first appearance, overwintering stage, diet breadth, and range/distribution
| Model no. (i) | Model wt. (wi) | First app.b | Overw. Stage | No. Plants | Per. Nat. | Lat. Ext. | No. Plants* Per. Nat. | No. Plants* Lat. Ext. | Per. Nat.* Lat. Ext. |
|---|---|---|---|---|---|---|---|---|---|
| 1 | 0.394 | No | Yes | Yes | Yes | Yes | No | Yes | Yes |
| 2 | 0.250 | Yes | Yes | Yes | Yes | Yes | No | Yes | Yes |
| 3 | 0.144 | Yes | Yes | Yes | Yes | Yes | Yes | No | Yes |
| 4 | 0.111 | Yes | Yes | Yes | Yes | Yes | No | Yes | Yes |
| 5 | 0.101 | No | Yes | Yes | Yes | Yes | Yes | No | Yes |
| w+ i a (cum. w+) | 1.000 | 0.505 | 1.000 | 1.000 | 1.000 | 1.000 | 0.245 | 0.755 | 1.000 |
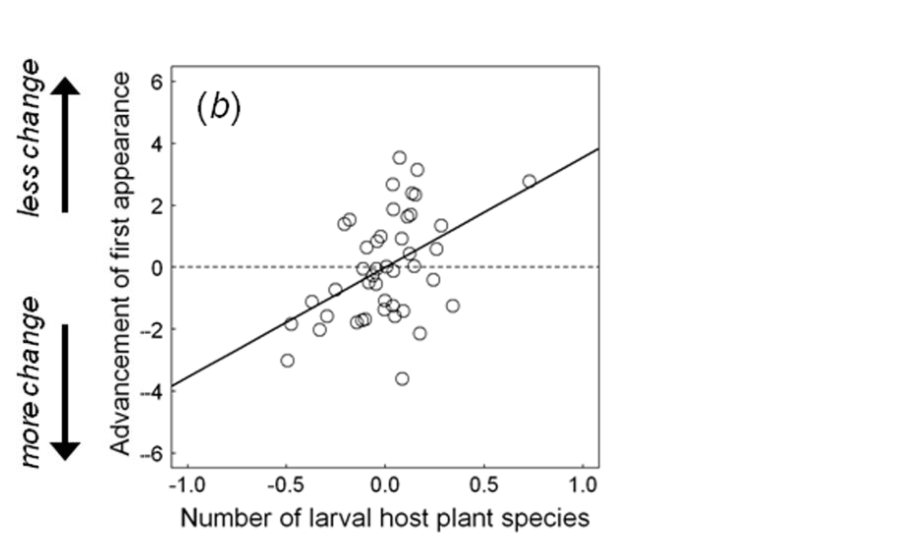
Partial regression plot
Residuals of
y ~ xi … xn (- x*)
Residuals of
x* ~ xi … xn
‘Significant’ predictors (p < 0.05, full model of all terms from best-fitting models; type III SS)
Species that overwinter as adults advance more than other stages
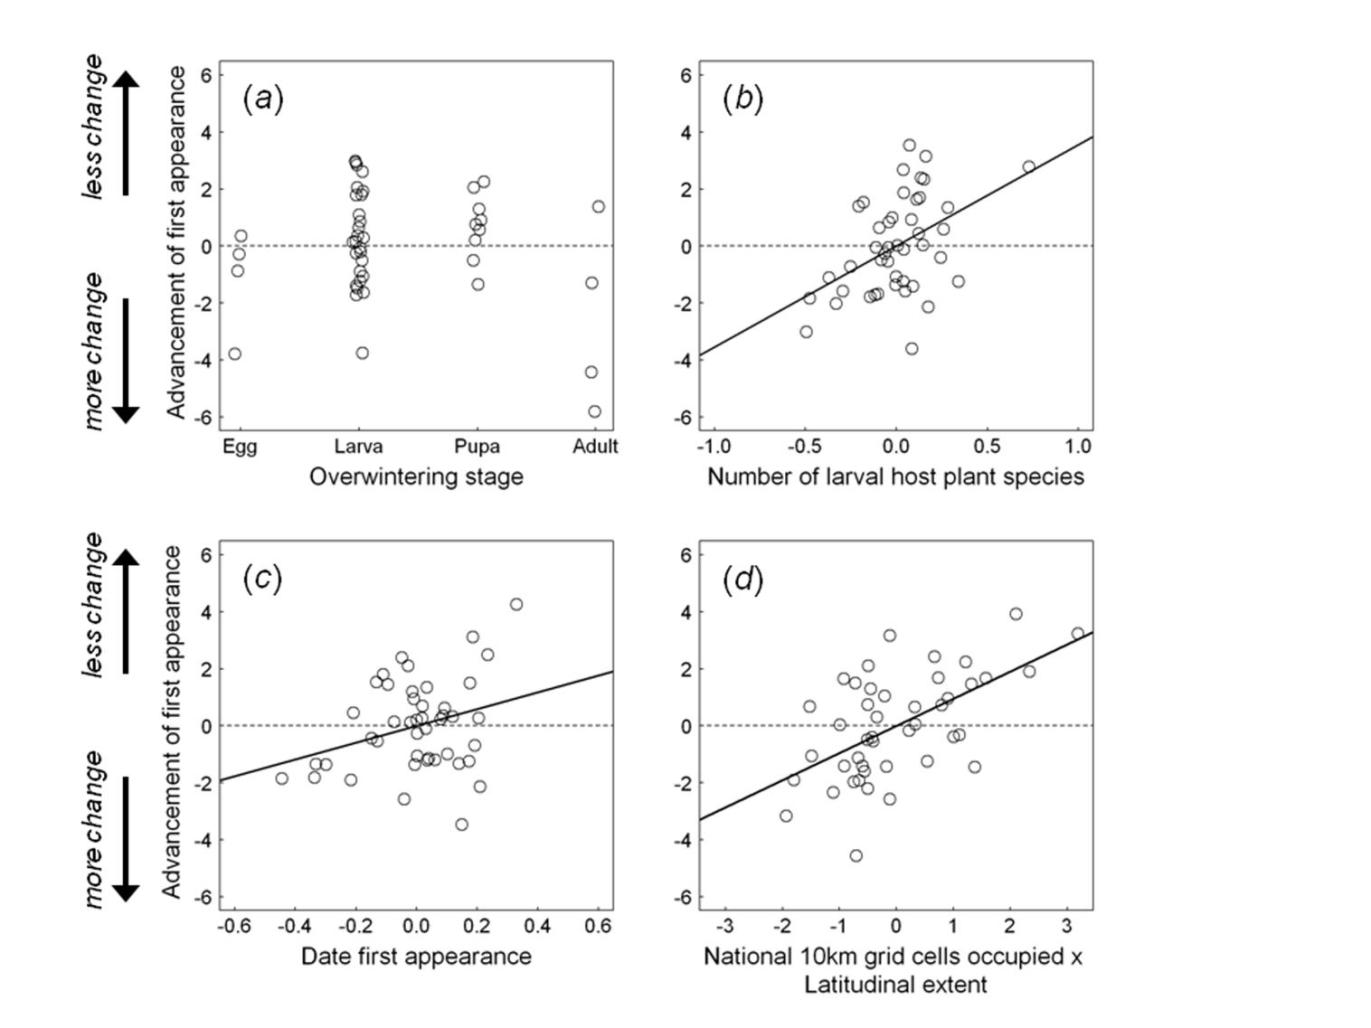
‘Significant’ predictors (p < 0.05, full model of all terms from best-fitting models; type III SS)
Species with narrower diet breadths advance more
‘Significant’ predictors (p < 0.05, full model of all terms from best-fitting models; type III SS)
Species that have earlier annual dates of first appearance advance more
‘Significant’ predictors (p < 0.05, full model of all terms from best-fitting models; type III SS)
Species that have earlier annual dates of first appearance advance more
Summer (1 °C)
Spring (1.5 °C)
‘Significant’ predictors (p < 0.05, full model of all terms from best-fitting models; type III SS)
Species that occupy less habitat advance more
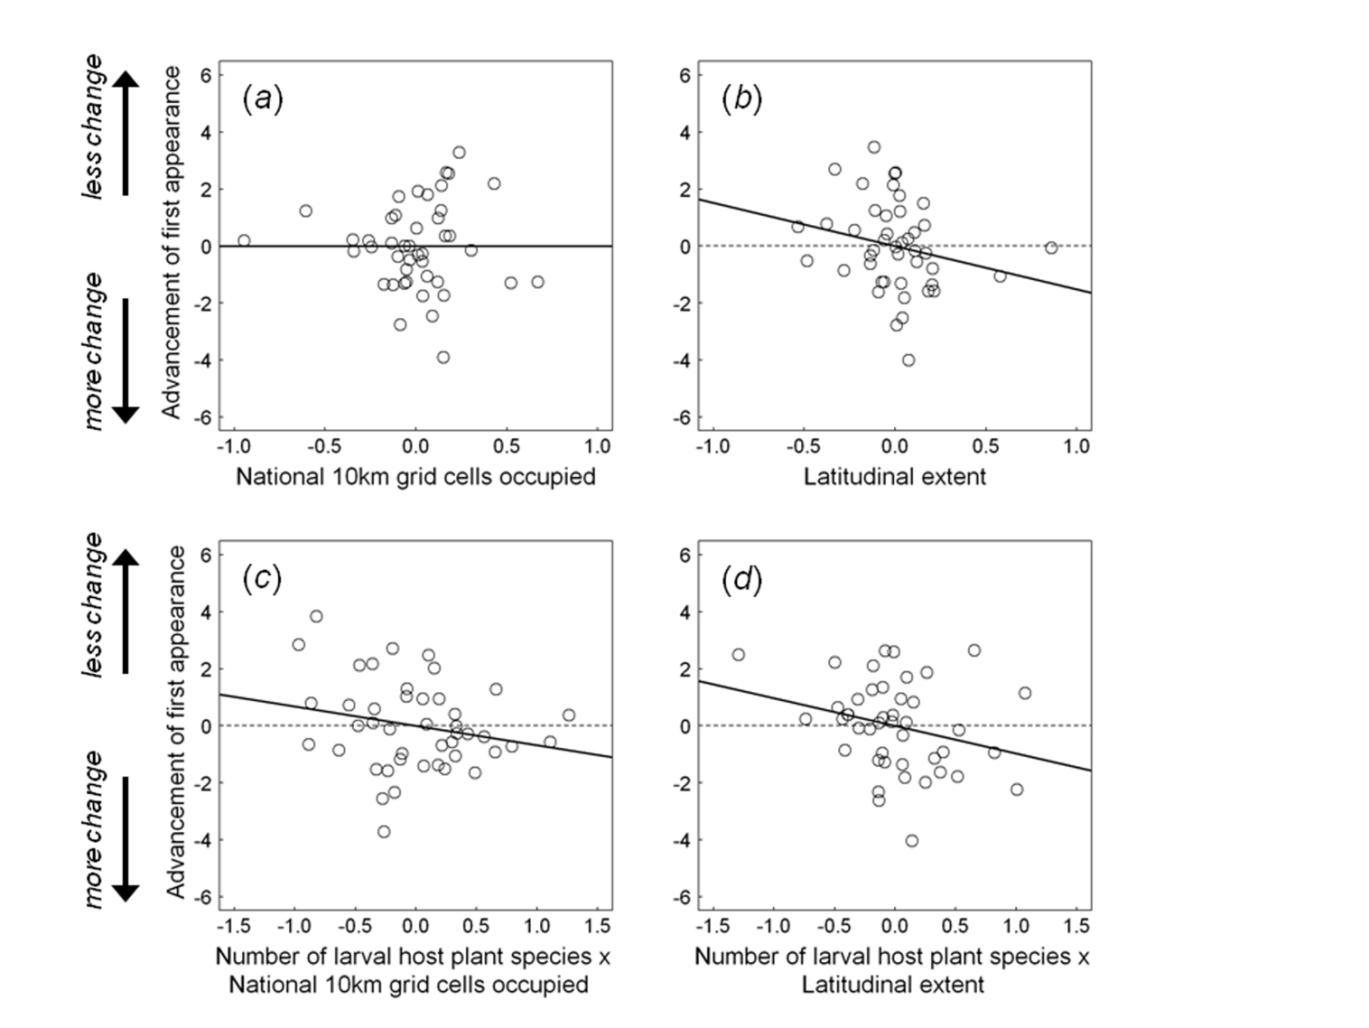
‘Non-significant’ predictors (p < 0.05, full model of all terms from best-fitting models; type III SS)
Implications
- Basic research
- Identifies patterns between phenology & life history / species-level traits
- Suggests testable hypotheses for the bases of these patterns
- Especially need to link magnitude of phenological response with performance
- Applied research & Conservation
- Identify those species that will respond most strongly to climate change
- UK butterflies
- Other species with particular life histories
- Identify those species that will respond most strongly to climate change
Acknowledgements
- Univ. North Carolina collaborators
- Alicia Frame, Ryan Martin, Lauren Buckley
- UKBMS and volunteers
Volunteer-based ant sampling
- North Carolina State University
- Rob Dunn lab / Andrea Lucky ([email protected])
- ‘Ants in your Backyard’ / citizen science program
- Baiting for ants in your yard and house
- Sending samples to be processed in the Dunn lab